Need comprehensive property data in record time?
Tap into one of the biggest real estate data sources.
Albany County property data: comprehensive, frequently updated, all in one place.
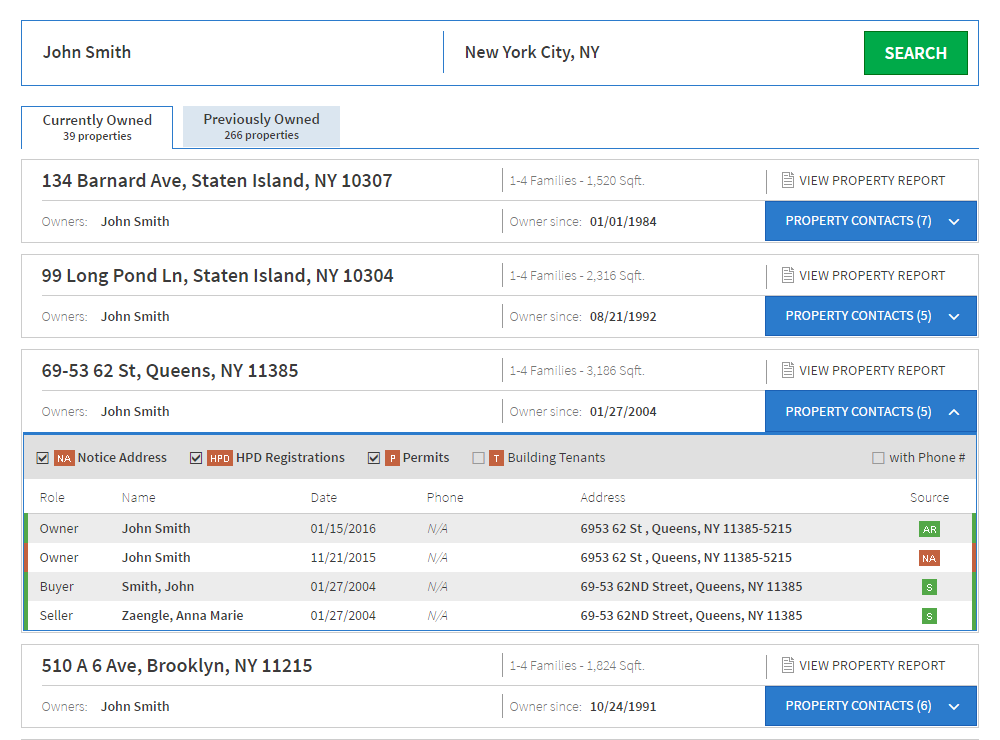
- Owner name and contact details
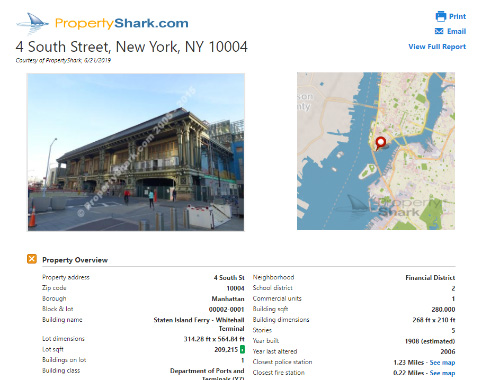
- Property characteristics
- Property value
- Zoning
- Sales history
- Permits
- Maps
- Property class
- Lot size
- Square footage
- Year built and much more!
Owner Names & Contact Details
- Owner names at your fingertips.
- Mailing addresses and phone numbers.
- Search by owner name available.
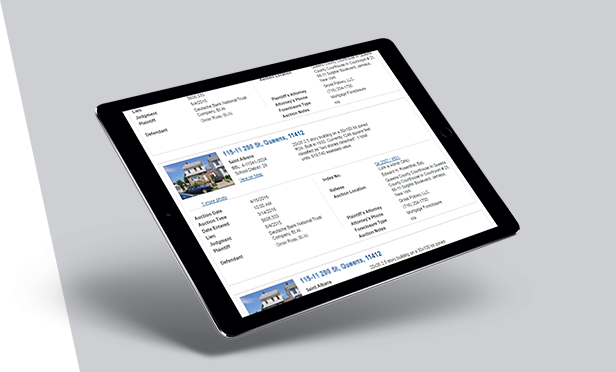
Foreclosure Listings in Albany
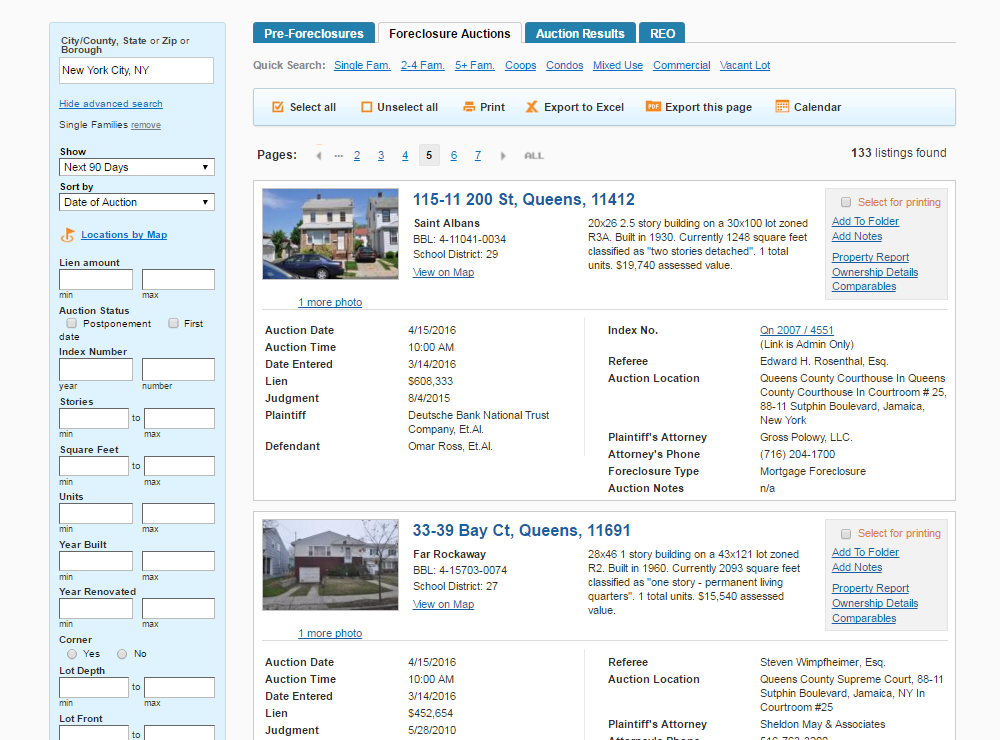
- Auction date, time & location.
- Pre-foreclosure listings.
- In-depth property data for all listings.
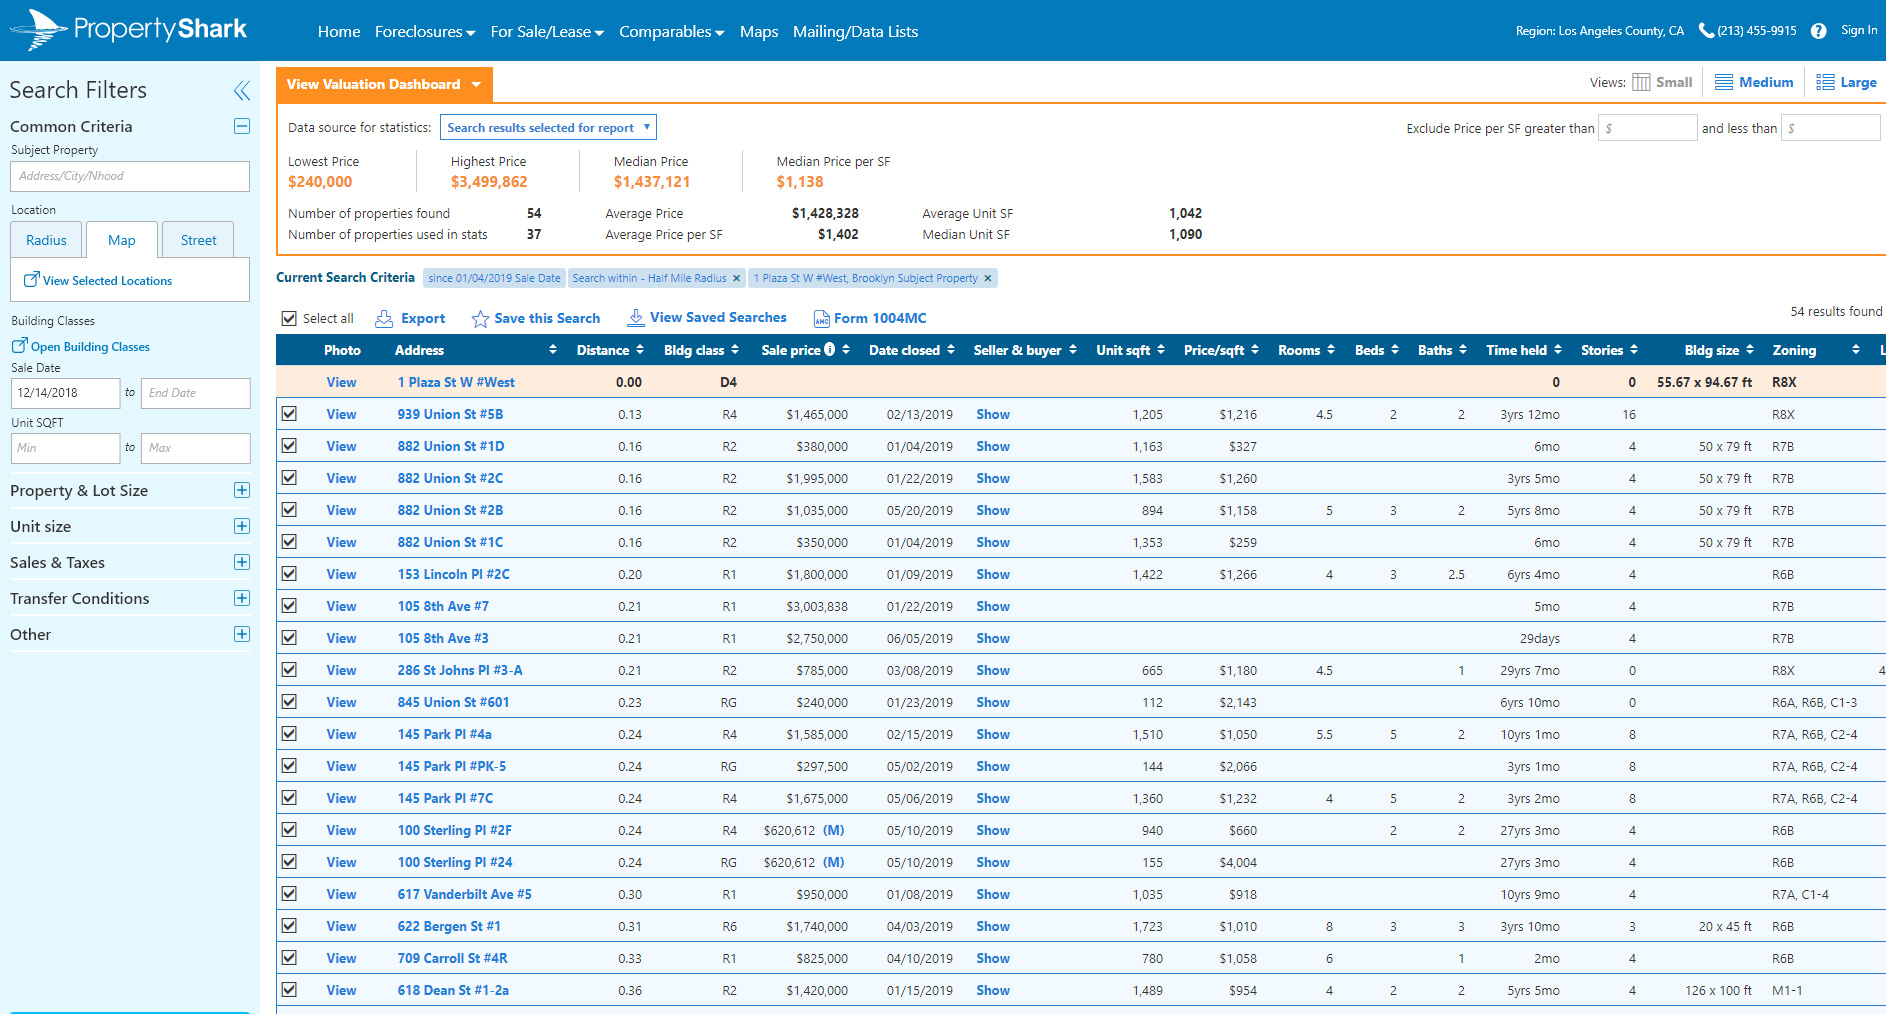
Property Value Estimates
- Highly customizable Comps tool.
- Flexible and robust filtering.
- Sales data updated daily.
Major industry players trust PropertyShark as their data provider:


Albany Market Overview
- No. of residential properties
- 21,283
- No. of commercial properties
- 1,281
- No. of upcoming foreclosures
- 8
- No. of foreclosures in the past 12 months
- 74
| Address | Sale price | Sale date |
|---|---|---|
| 35 Pine Tree Ln | $999,999 | 06/22/2021 |
| 563 Morris St | $230,000,000 | 12/10/2021 |
| 9 Watervliet Ave | $2,655,000 | 08/10/2021 |
| 16 Limerick Dr | $2,400,000 | 02/24/2022 |
| 369 2 St | $1,000,000 | 07/20/2022 |
| Address | Tax amount | Tax year |
|---|---|---|
| 64 Eagle St | $41,414,182 | 2023 |
| 1200 Washington Ave | $30,479,706 | 2023 |
| 1400 Washington Ave | $22,092,000 | 2023 |
| 251 Fuller Rd | $15,133,020 | 2023 |
| 632 New Scotland Ave | $12,984,525 | 2023 |
Albany Demographics
| Average household income | $73,144 |
| White collar | 64.77% |
| Blue collar | 35.23% |
| Family households | 67.84% |
| Households with kids | 34% |
| Housing units | 656 |
| Occupied housing units | 633 |
| Owner occupied units | 82.95% |
| Average number of people per household | 3 |
| Median year structure built | 1983 |
| Houses with motgage | 49.92% |
| Median value for units with a mortgage | $174,200 |
| Median value for units without a mortgage | $157,300 |
| Median gross rent | $701 |
| Median housing costs per month | $934 |
| Population in poverty | 8.48% |
Nearby cities
| Name | Median Sale Price |
|---|---|
| Chicopee | $172,500 |
| Glens Falls | $168,247 |
| East Greenbush | $211,500 |
This page was last updated on 2023-03-24
Read our blog
-
 Dec 12, 2023
Pros & Cons of Mayor Adams’ Zoning Change Proposal to Boost Housing Supply in New York City
Meant to boost NYC’s housing stock, Mayor Adams has proposed a number of zoning changes to ease the development and redevelopment process.
Read more -
 Dec 12, 2023
Top 50 Most Expensive NYC Neighborhoods in 2023: Sales Activity, Prices Down Compared to Last Year
The median sale price slipped to $728,000 in 2023, a 3% fall compared to 2022, marking the first year-over-year decline in over a decade.
Read more -
 Dec 05, 2023
Manhattan Leads U.S. in Office Mortgage Maturities
A significant 32.5% of Manhattan’s total office mortgage volume — which amounts to $56.7 billion — is set to mature by the end of 2026.
Read more
